
Page 34 - Spring2012
P. 34
noradrenalin) and lipids (cholesterol and triglyc- Although there is a quantity of data describing storage of sodium
erides). Renin and aldosterone were of particular within the body, it is difficult at this stage to speculate what role storage
concern as they have been repeatedly associated plays in maintaining physiological homeostasis. It therefore remains for
with increases in cardiovascular mortality in us to determine what type of data are available to give us an indication
long-term follow-up studies. of the optimum level of consumption. Simply from a biological feedback
During his Presidential address to the In- perspective, the point at which a deficiency of salt elicits an increase in
ternational Society of Hypertension, Alderman renin production must be considered a basic biological indicator. Using the
referred to a J-shaped response to describe the study of Alderman, et al., anything less than 170 mmol (3,910 mg) sodium
1
broader impact of sodium intake on health out- per day appears as a starting point. As increases in renin only occur when
comes, referring to evidence of harm observed sodium intake is insufficient, these data do not permit an estimate for an
at the low and high extremes of consumption, upper limit.
with the least impact noted in a broad middle
range centered around 3,500 mg sodium or 1.5 SALT CONSUMPTION AND LIFE EXPECTANCY
teaspoons of salt per day. Average life expectancy is often considered a measure of the overall
30
In a recent study, published in the Journal health of a population, (although infant mortality in some countries can
of the American Medical Association (JAMA), 31 be a confounding factor). Comparing the InterSalt study data on average
researchers found moderate salt intake to be sodium consumption in thirty-two countries around the world with life
34
associated with the lowest risk of cardiovascu- expectancy results in the following picture. If we take the top 20 percent
lar events, whereas low intakes, equivalent to with greatest life expectancy, their sodium intake ranges from 140–205
less than or equal to 3,000 mg sodium or 1.5 mmol per day, averaging around 170 mmol (1.75 teaspoons of salt). While
teaspoons of salt per day, were associated with no cause-and-effect relationship between sodium intake and lifespan is
an increased risk of cardiovascular death and implied, the data do demonstrate the compatibility between life expectancy
hospitalization for congestive heart failure, and and the associated levels of sodium intake.
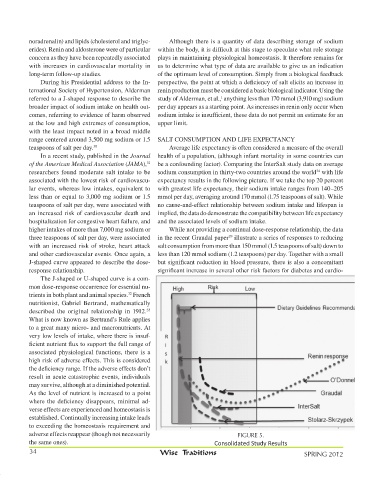
higher intakes of more than 7,000 mg sodium or While not providing a continual dose-response relationship, the data
three teaspoons of salt per day, were associated in the recent Graudal paper illustrate a series of responses to reducing
29
with an increased risk of stroke, heart attack salt consumption from more than 150 mmol (1.5 teaspoons of salt) down to
and other cardiovascular events. Once again, a less than 120 mmol sodium (1.2 teaspoons) per day. Together with a small
J-shaped curve appeared to describe the dose- but significant reduction in blood pressure, there is also a concomitant
response relationship. significant increase in several other risk factors for diabetes and cardio-
The J-shaped or U-shaped curve is a com-
mon dose-response occurrence for essential nu-
trients in both plant and animal species. French
32
nutritionist, Gabriel Bertrand, mathematically
described the original relationship in 1912.
33
What is now known as Bertrand’s Rule applies
to a great many micro- and macronutrients. At
very low levels of intake, where there is insuf-
ficient nutrient flux to support the full range of
associated physiological functions, there is a
high risk of adverse effects. This is considered
the deficiency range. If the adverse effects don’t
result in acute catastrophic events, individuals
may survive, although at a diminished potential.
As the level of nutrient is increased to a point
where the deficiency disappears, minimal ad-
verse effects are experienced and homeostasis is
established. Continually increasing intake leads
to exceeding the homeostasis requirement and
adverse effects reappear (though not necessarily FIGURE 5.
the same ones). Consolidated Study Results
34 Wise Traditions SPRING 2012 SPRING 2012 Wise Traditions
89494_text.indd 34 3/13/12 1:47 AM