
Page 23 - Summer2010
P. 23
article, is at a serum 25(OH)D concentration of everyone” as opposed to “the average person,” Vitamin D
88 nmol/L (35.2 ng/mL). It is interesting that but in fact the authors stated that they did not
this estimate is very close to that produced by use the data from Figure 5 to determine this saturates its
previous attempts to define the lower end of the point because a different and apparently inferior activation
normal range from the relations of serum 25(OH) method of measuring vitamin D levels was used enzymes and
D to calcium absorption and to serum parathy- in that data set.
roid hormone concentration (ie, 75–85 nmol/L, So, we are back to the authors’ original starts
or 30–34 ng/mL).” conclusions, that vitamin D saturates its activa- getting stored
According to the authors of this study, then, tion enzymes and starts getting stored in body in body fat
the point at which the vitamin D enzymes are fat when 25(OH)D levels reach 35 ng/mL (88
saturated and vitamin D “accumulates within nmol/L). when 25(OH)
the body, both in serum and probably in body The second problem is that this study does D levels reach
fat” is not 40 or 50 ng/mL (100 or 125 nmol/L) not “prove” or “show” or “demonstrate” what the 35 ng/mL.
but rather 35 ng/mL (88 nmol/L). optimal or minimal blood level of vitamin D is.
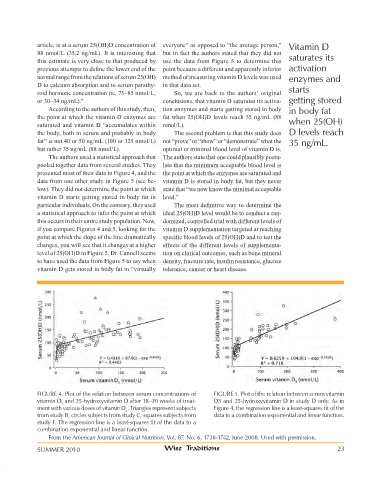
The authors used a statistical approach that The authors state that one could plausibly postu-
pooled together data from several studies. They late that the minimum acceptable blood level is
presented most of their data in Figure 4, and the the point at which the enzymes are saturated and
data from one other study in Figure 5 (see be- vitamin D is stored in body fat, but they never
low). They did not determine the point at which state that “we now know the minimal acceptable
vitamin D starts getting stored in body fat in level.”
particular individuals. On the contrary, they used The most definitive way to determine the
a statistical approach to infer the point at which ideal 25(OH)D level would be to conduct a ran-
this occurs in their entire study population. Now, domized, controlled trial with different levels of
if you compare Figures 4 and 5, looking for the vitamin D supplementation targeted at reaching
point at which the slope of the line dramatically specific blood levels of 25(OH)D and to test the
changes, you will see that it changes at a higher effects of the different levels of supplementa-
level of 25(OH)D in Figure 5. Dr. Cannell seems tion on clinical outcomes, such as bone mineral
to have used the data from Figure 5 to say when density, fracture rate, insulin resistance, glucose
vitamin D gets stored in body fat in “virtually tolerance, cancer or heart disease.
FIGURE 4. Plot of the relation between serum concentrations of FIGURE 5. Plot of the relation between serum vitamin
vitamin D and 25-hydroxyvitamin D after 18–20 weeks of treat- D3 and 25-hydroxyvitamin D in study D only. As in
3
ment with various doses of vitamin D . Triangles represent subjects Figure 4, the regression line is a least-squares fit of the
3
from study B; circles subjects from study C; squares subjects from data to a combination exponential and linear function.
study F. The regression line is a least-squares fit of the data to a
combination exponential and linear function.
From the American Journal of Clinical Nutrition, Vol. 87, No. 6, 1738-1742, June 2008. Used with permission.
SUMMER 2010 Wise Traditions 23