
Page 42 - Winter2009
P. 42
The blood for 4. BLOOD COAGULATION SCORES • Fibrin, which appears as white threads in
all subjects COMPARED FOR THE TWO DIETS the blood plasma.
The blood for all subjects as observed in live •
Spicules, a form of fibrin that appears as very
as observed blood analysis was scored for factors related to short threads.
in live blood clotting and inflammation by observing the fol- • Shape changes in RBCs, which transform
analysis was lowing variables and scoring them using a five- from round cells to amorphous shapes that
pack like bricks to form an impervious wall
level Likert scale from 0 (none; which is most
scored for desirable) to 4 (highest possible level observed; in a blood clot.
factors related which is least desirable):
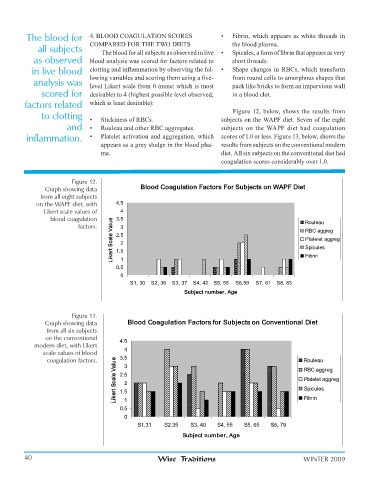
Figure 12, below, shows the results from
to clotting • Stickiness of RBCs. subjects on the WAPF diet. Seven of the eight
and • Rouleau and other RBC aggregates. subjects on the WAPF diet had coagulation
inflammation. • Platelet activation and aggregation, which scores of 1.0 or less. Figure 13, below, shows the
appears as a grey sludge in the blood plas- results from subjects on the conventional modern
ma. diet. All six subjects on the conventional diet had
coagulation scores considerably over 1.0.
Figure 12.
Graph showing data Blood Coagulation Factors For Subjects on WAPF Diet
from all eight subjects
on the WAPF diet, with 4.5
Likert scale values of 4
blood coagulation 3.5 Rouleau
Likert Scale Value 2.5 Platelet aggreg
factors. 3 RBC aggreg
2
Spicules
1.5
1
0.5 Fibrin
0
S1, 30 S2, 36 S3, 37 S4, 42 S5, 55 S6,59 S7, 61 S8, 83
Subject number, Age
Figure 13.
Graph showing data Blood Coagulation Factors for Subjects on Conventional Diet
from all six subjects
on the conventional 4.5
modern diet, with Likert
scale values of blood 4
coagulation factors. 3.5 Rouleau
Likert Scale Value 2.5 Platelet aggreg
3
RBC aggreg
2
Spicules
1.5
1
0.5 Fibrin
0
S1,31 S2,35 S3, 40 S4, 55 S5, 65 S6, 79
Subject num ber, Age
40 Wise Traditions WINTER 2009