


 🖨️ Print post
Climate Change Part III: The Emperor’s New Clothes
Mark Twain was fond of saying, “History doesn’t repeat itself, but it often rhymes.” I find this maxim holds true when thinking about the tremendous societal and cultural changes brought on by our current age of the Internet and mass media saturation. When looking for historical examples to help illuminate the current state of affairs, I am often reminded of a small mechanical advancement five hundred years ago, when the synthesis of small combinations of different technologies into a new medium of communication—the Gutenberg printing press—ultimately had enormous implications and underpinned a wholesale restructuring of society for hundreds of years to come. That development was not so dissimilar to the changes driven today by the Internet age.
THE INTERNET AGE AND THE CLIMATE CHANGE NARRATIVE
As with Gutenberg’s printing revolution, the invention of the Internet enabled the ultra-cheap reach of information on a global scale. When the cost of distributing information is dramatically reduced, the gatekeepers of that information increase both in number and in importance. In Luther’s time, the gatekeeping of information defaulted to the clergy on both sides of the Catholic-Protestant divide. In modern times, the gatekeeping function has been transferred from the clergy to “the experts”—and there are a lot of them, so much so that the challenge for lay people (myself included) becomes which experts to trust. As has been the case throughout human history, at the end of the day, gatekeepers are people, and people respond to incentives. In my opinion, we should evaluate the trustworthiness of individual “experts” less on what they specifically say and more on whether their incentives align with our own value system. But as they say, the devil is in the details, and the challenge is that most of our “experts” are appointed rather than elected and as such are under no obligation to truthfully declare what their individual incentives actually are.
Researchers (a type of “expert”) now perform and present climate “science” with hundreds (if not thousands) of climate-change-related papers each year, but many of the papers are written in a jargon-rich gobbledygook that makes them all but indecipherable to the common citizen. Take, for example, the following section from the “authoritative” scientific paper published twenty-five years ago by Michael Mann and company; this is the paper that provided the basis for the “hockey stick” graph that many global climate change adherents point to as definitive proof of man-made climate change driven by carbon dioxide emissions:
“In the reconstructions from 1820 onwards based on the full multiproxy network of 112 indicators, 11 eigenvectors are skillfully resolved (nos 1–5, 7, 9, 11, 14–16) describing ~ 70–80% of the variance in NH and GLB mean series in both calibration and verification. (Verification is based here on the independent 1854–1901 data set which was withheld; see Methods.) Figure 3 shows the spatial patterns of calibration β, and verification β and the squared correlation statistic r2, demonstrating highly significant reconstructive skill over widespread regions of the reconstructed spatial domain. 30% of the full spatiotemporal variance in the gridded data set is captured in calibration, and 22% of the variance is verified in cross-validation.”1
In the twenty-five years since this paper’s publication, the problem of scientific support for the theory of human-induced climate change being written in indecipherable techspeak has, if anything, gotten worse. Several factors have contributed to the worsening situation: the need (for the purposes of upholding the official climate change narrative) to make the basic science even less discernible, given that skeptics of human-induced climate change are actually reading these papers and asking questions; the use of artificial intelligence (AI) large language models (LLM) to write papers; and the presence of industrial-scale paper mills, largely based in India and China, that churn out thousands of papers a year, “flooding the zone” with noise. This allows unscrupulous actors in the media or other large “non-profit” institutions to use the published “science” to draw whatever conclusions they think will cause the largest media sensation, thereby drawing eyeballs, generating clicks and leading to more advertising revenue for the media company.
Ample evidence also indicates that within the scientific community, there exists a core clique of human-induced-climate-change zealots who are highly credentialed, hold a strong degree of influence within the broader scientific community and are quite ruthless toward anyone who asks questions about their central position. In November 2009, an anonymous hacker or insider leaked a trove of emails and documents from the University of East Anglia’s Climate Research Unit (CRU) in an event dubbed “ClimateGate.” Although the email leaks stopped short of proving that the basic science behind human-induced climate change is some grand conspiracy, in my opinion they did show that an inner clique of climate scientists (of which Mann is one) is using a large number of statistical tricks to force conclusions that fit their prime narrative. The leaks also revealed that the most prestigious scientific journals have been subjected to heavy and punitive pressure to publish only those papers that conform to the narrative, while bullying or outright smearing scientific colleagues who have dared to ask questions or form their own conclusions based on alternative work.
After publication of the ClimateGate emails, several skeptics did write articles or items in the spirit of scientific inquiry that asked questions or challenged the professionalism of the inner clique. As their reward for disputing the consensus, the mysteriously deep-pocketed Michael Mann sued them for libel and bled them financially dry through fifteen years of constant litigation. To this day, Mann continues to serve as the modern incarnation of a grand inquisitor, using his credentials to mock or outright condemn dissenting opinion on various social media platforms (see Figure 1).

Another issue to note regarding the scientific community focused on human-induced climate change has to do with their parasitic marriage with the mainstream media and prominent non-governmental organizations (NGOs). Both types of organizations translate dubious and agenda-driven “science” into a high-volume, mass communication narrative. This results in a forced consensus and an obsessive focus by the media on the apparent association between human-induced climate change and natural disasters (discussed further in the next section).
A CONTRIVED CONSENSUS
As one of its main talking points, the climate change narrative argues that there is almost universal consensus within the scientific community that the main driver of climate change—and of the one to two degrees Celsius of warming that the earth has experienced over the past one hundred fifty years—is entirely due to man-made greenhouse gas emissions. One example is a piece of advertising published in 2013 by the Consensus Project,2 frequently used in the mainstream media and social media to block dissent and questions regarding global climate change.
The Consensus Project used a 2013 review by Cook and colleagues to buttress its reported 97 percent consensus rate, a study that apparently reviewed nearly twelve thousand peer-reviewed climate change abstracts published over two decades (1991–2011).3 (Wikipedia happily reports that the consensus on anthropogenic or human-caused global warming reached 100 percent in 2019, with a slight regression to 99 percent in 2021.4) However, this type of analysis has several problems. First, the data points are incredibly easy to cherry-pick; the reader must rely on the ethical compass of the authors to ensure that they did not selectively omit non-consensus papers. Second, as the leaked ClimateGate emails showed, during the Cook study’s two-decade time frame, there definitely existed a vocal and powerful clique of climate scientists who were manipulating the peer-review process and exerting bullying pressure on leading scientific journals about what to publish and what to bury.
Lastly, the conclusion reported by Cook and co-authors—that “the number of papers rejecting the consensus on [anthropogenic global warming] is a vanishingly small proportion of the published research”—is misleading.3 Of the twelve thousand climate science abstracts reviewed, the majority (66.4 percent) actually offered no opinion on human-induced climate change.5 Thus, the correct interpretation of the study used to develop the Consensus Project’s graphic is that just 33.6 percent of abstracts (about four thousand) explicitly discussed anthropogenic global warming (AGW), and in 97 percent of those, the authors endorsed human-induced climate change. Two-thirds of all abstracts “expressed no position” on the subject whatsoever (Figure 2).
In fact, many prominent scientific voices reject outright the notion of carbon-dioxide-driven global warming. Leading dissenters include Judith Curry,6 Freeman Dyson,7 Ian Plimer,8 the Nobel-prize-winning physicist Ivar Giaver,9 former Greenpeace president Patrick Moore,10 and interestingly enough, one of the Obama Administration’s main science advisers, physicist Steven Koonin.11 However, the output of this cohort of scientific voices tends to be excluded from the “consensus” argument.
“GLOBAL TEMPERATURE”: NO SUCH THING
The main tool that proponents of the human-induced climate change narrative use to continually reinforce their argument is their claim of a steady rise in global temperatures. As I discussed in Part I of this series,12 this increase is often framed in terms of a global average or mean temperature—which they present as the paradigm of scientific rigor. This calculated global average temperature is then represented as a difference or anomaly in a time series of similarly averaged temperatures as shown in a figure from the National Oceanic and Atmospheric Administration (NOAA) (see Figure 3).
These adherents imply that, given the certainty with which these global measurements are cited, the world has a precisely calibrated and logically designed system of temperature monitoring stations. To produce this type of precise result, however, one would expect to find an official temperature monitoring station every fifty to one hundred miles extending across the earth both laterally and longitudinally. The simple reality is that there is no such system and no such thing as a global average or mean temperature.
A simplified mathematical example can serve to illustrate this point. Imagine that all of Earth’s population lives in two temperature concentrations. The average temperature for Group A is thirty degrees Fahrenheit, while the average temperature for Group B is ninety degrees Fahrenheit, putting the average temperature of this simple Earth at sixty degrees Fahrenheit. Does this have any relevance or meaning for either of the two population groups?
Prior to the 1950s, reliable instrument-based temperature measurements existed only in Europe and North America and select coastal portions of Asia and the Southern Hemisphere; temperature data from the communist or former-communist countries (Russia and China) are highly suspect. Even today, no official temperature monitoring exists for large swaths of the globe, including the oceans, high mountain ranges, the Sahara Desert and the Amazon rainforest. In short, this type of “global average”—like so many other aspects of the climate change discussion— is highly susceptible to cherry-picking, requires large data inferences and is prone to whole-scale data manipulation and other statistical tricks.
Even with the above caveats, the United States is considered to have the most extensive, complete and usable large-scale and long-term temperature data—the “gold standard,” if you will. However, closer inspection reveals that there are significant issues even with the U.S. temperature data. Although the U.S. does have a system of temperature and meteorological instrumentation stations that conforms to an excellent scientific standard known as the U.S. Climate Reference Network (USCRN)—consisting of one hundred fourteen stations in the contiguous U.S., twenty-one in Alaska and two in Hawaii—this system has been in service only since 2002, so at best it contains just twenty-two years of data.
The interesting thing about this data set is that it shows no easily discernible warming trend (see Figure 4). As has become standard with these large average temperature measurements, the figure shows recent average temperatures as an anomaly compared to some historic average data. In this case, the reference temperature data set stretches from 1981 to 2010, which is odd given that the USCRN temperature stations have only been in service since 2002. This means that what we are seeing in Figure 4 is an apples-to-oranges comparison; that is, what this is showing is average data from the USCRN (2000–present) data stations as a difference to some other data that have not been designed and maintained to the same standard as the USCRN data stations.
Outside of the USCRN, there are some nine hundred other U.S. temperature monitoring stations, which often have much longer data series than the USCRN set. This larger temperature and weather monitoring system, the Automated Surface Observing Station (ASOS), is administered by the National Weather Service (NWS), the Federal Aviation Administration (FAA) and the Department of Defense (DOD) and in all likelihood provided the reference data set referred to in Figure 4. However, the ASOS system has a bias problem, as the vast majority of ASOS stations are located at airports, where you have miles and miles of solar-radiation-absorbing black asphalt runways and hundreds of jet combustion engines exhausting hot flue gas. This makes all measurements at these stations highly susceptible to an airport heat effect version of the urban heat effect, artificially raising the surface temperature compared to the non-airport surrounding area.
That points to the other general problem with temperature measurements. When not located at airports, most temperature measuring stations are located near or in large urban concentrations, where the design, population and concentration of mechanical heating and cooling equipment trap heat and artificially raise the temperature compared to proximal non-urban areas. The urban heat island effect can add up to ten degrees Fahrenheit to the ambient temperature. Urban areas have only grown in size and number since 1850. Thus, when urban area data points are used in large-scale temperature averages, they artificially bias the average temperature higher.
NATURAL DISASTERS AND HEAT WAVES
Now, let’s consider natural disasters such as hurricanes, tornadoes and fires as well as phenomena like heat waves. We are all well accustomed to the media frenzy that kicks in whenever a major hurricane storm forms in the Atlantic. Nonetheless, the data show no measurable increase in hurricane storm formation, land fall frequency or intensity since the U.S. Civil War, and the trendline is similar for Pacific hurricanes and tropical cyclones (Figure 5). What has changed since the Civil War is the sizable increase in the population living along the U.S. Gulf Coast and in Florida due to the advent of air conditioning.
As for tornadoes, at first glance the raw data suggest that tornadoes in the U.S. have indeed become more frequent over the last twenty years. However, the reality is that this increased tornado frequency is only observable in smaller tornadoes (categories EF0 and EF1 measured with the Enhanced Fujita Scale) (Figures 6A amd 6B). It is only in the past forty years (since the 1990s) that improved instrumentation and weather monitoring have made it possible to measure these “weaker” tornadoes reliably, which suggests that these smaller tornadoes likely were there all along. Stronger Midwest tornadoes (EF3-EF5) show a decreasing trendline frequency over the past seventy-five years.
Wildfires are, for the purposes of human-induced climate change propaganda, one of the most abused natural phenomena. Almost without fail, every May through August a deluge of headlines proclaims “the worst wildfire season in history,” along with pronouncements that climate change is leading to more frequent and severe wildfires that are burning hotter, followed by the claim that the wildfires are themselves making global warming worse. The large Canadian wildfires that resulted in eerie sunsets and affected air quality as far away as New York City and Philadelphia in the summer of 2023 are a typical example of what has become an annual rite of passage. For several months, almost daily front-page headlines described the extent of the wildfire and the “record-level” acreage burned (Figure 7), with the sole cause of each new inferno confidently attributed to climate change.
Wildfires in California, Australia, Greece and other fire-prone regions have demonstrated a similar media pattern; about six months after the fires have been controlled and tamed, a small story appears, buried well beneath the fold, stating that the fires actually were caused by arsonists, poor campground management or inadequate electric utility line management. In other words, the cause is human activity or poor human oversight but has nothing to do with the concentration of carbon dioxide in the atmosphere. True to this pattern, here is the small excerpt published on February 9, 2024 regarding the 2023 Canadian wildfires:
“On Jan. 15, a Quebec man, Brian Paré, pleaded guilty to 13 counts of arson and one count of arson with disregard for human life. In May, with 12 active fires already burning in Quebec, Paré, a conspiracy theorist, began setting his own fires with the intention of finding out ‘whether the forest was really dry or not,’ Quebec Prosecutor Marie-Philippe Charron told the court. Paré claimed on social media posts that the previous fires had been set by the Canadian government to convince people to believe in climate change, the Canadian Press reported.”13
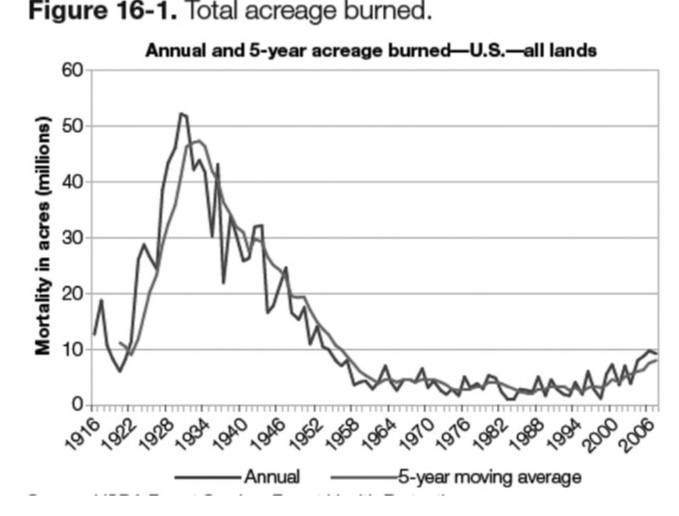
Another interesting detail about the annual claims of “record-setting” wildfires is the use of a common media disinformation tactic—the truncated time-series distortion. In Figure 7, the display of “Canadian Acreage Burned” goes back only twenty years. The U.S. Department of Agriculture’s Forest Service, through the National Interagency Fire Center (NIFC), has long served as the custodian of data regarding wildfire acreage burned in the U.S., with records going back to the early 1900s. In March 2021, however, the NIFC scrubbed their dataset and removed all wildfire data prior to 1983, resulting in the pattern shown in Figure 8. That figure shows a steady increase in wildfire acreage burned over the past forty years, which fits the narrative that an increasing concentration of atmospheric carbon dioxide results in an ever-increasing wildfire risk.
However, this slice of data paints a grossly misleading picture. When you look at the full dataset going back over a century, you see that wildfire acreage burned in the U.S. in recent years is as low and controlled as it has ever been, representing about 20 percent of the peak burned acreage of the 1920s and 1930s (Figure 9).
Another thing to note on wildfires is that America’s urban sprawl vastly expanded over the twentieth century. Thus, just as with hurricanes, when wildfires occur, they are much more likely to threaten health and property than was the case one hundred years ago.
Often ignored in wildfire discussions is the fact that government agency policies play a large part in the severity and likelihood of wildfires. Controlled burning of dry undergrowth was standard U.S. Forest Service policy for much of the twentieth century, but because fire always results in combustion and the release of carbon dioxide, environmental groups have placed controlled burns under scrutiny and pressure, with the result that burns have fallen out of favor as a standard tool of the Forest Service. Not performing controlled burns allows undergrowth to accumulate in U.S. forests; thus, when human ignorance or a random lightning strike start a fire, there is more fuel available to increase the size of each individual conflagration.
Heat waves furnish a final example of climate-change frenzy, with every heat dome that descends heralded as the second coming of the apocalypse and characterized as stronger, more severe and deadlier than ever. As we have already seen, long-term data paint a different picture, showing no appreciable increase in heat wave severity or frequency in the U.S. over the past one hundred thirty years. The peak of U.S. heat waves happened in the 1930s during the Dust Bowl era (Figure 10). And unlike the consequences of hurricanes and fires, the advent and widespread implementation of air conditioning has dramatically reduced the consequences of heat waves.
SEA LEVEL CHANGE, POLAR ICE CAPS AND POLAR BEARS
This aspect of the climate change discussion is a complicated one and challenging to simplify into layman’s terms. The general hypothesis is that as Earth warms, whether from natural or human-induced causes, the two polar ice caps (Arctic and Antarctic) and associated ice sheets will melt, with the incursion of excess melt water resulting in a sea-level rise predicted to inundate and flood coastal areas. In the mainstream media, this trend is usually communicated in one of two ways, either by forecasting an extreme erosion of coastline by some arbitrary date in the future (such as 2050 or 2100) or by publishing sensationalist headlines like “Scientists Worried as Iceberg the Size of Texas Breaks Away from Antarctica.”
Upon closer inspection, the ice and/or sea-level change discussion runs into a few problems. The main one is measurement-related, as we do not have even semi-credible records of ice extent in the Arctic or Antarctic regions from before the satellite era (pre-1980), and the way that ice extent is measured is a bit subjective anyway. Usually, polar cap ice extent is measured as “sea ice extent,” which is defined as the area of the ocean that is covered by ice that is at least 15 percent concentrated. The problem with this measurement method is that it does not actually measure the ice volume or mass at the poles; instead, it gives you a rough estimate of how much of the surrounding ocean is frozen or partially frozen. A second issue is that sea ice extent has huge seasonal variability between summer and winter (reversed seasons for the Southern Hemisphere).
Finally, sea ice extent only has a tangential connection to sea level rise—only when ice mass is moved from land to the oceans can it possibly be an influencing factor in average sea level rise, as water is semi-unique in that its liquid phase is denser than its solid phase (ice). In and of itself, sea ice extent does not tell you how much ice is moving from land into the ocean. Tracking since the 1980s shows that sea ice extent in the Arctic is decreasing, and in the Antarctic, it has been more or less unchanged for the last forty years. This is consistent with the fact of a slightly warming Earth, but by no means is it an indication of impending catastrophe.
For most of us in our everyday lives, what really matters is sea level change as measured by tidal gauges. The data in Figure 11, consistent with a slightly warming Earth, show that on average, sea levels have increased by about two hundred millimeters (mm) or about eight inches over the past one hundred twenty years. This works out to one and a half millimeters per year on average, about the thickness of a fingernail.
Such change is by no means unmanageable or outside of human experience. Long-term sea-level change derived from geological proxies shows that as Earth emerged from the last glacial maximum (roughly twenty thousand years ago) over a period of about six thousand years, global sea level increased by roughly one hundred twenty meters, or at a rate of twenty millimeters per year (Figure 12). This constitutes a rate of roughly fifteen times the current level during the age of anatomically modern humans—all prior to the Industrial Revolution—and at a purported atmospheric carbon dioxide level roughly 50 percent below current levels. If the human-induced global warming narrative were scientifically sound, these inconvenient facts would not be possible.
Finally, for anybody who came of age in the late 1990s, it should sound familiar that one of the earliest mascots of the human-induced climate change movement was the polar bear. According to the narrative’s logic, melting ice caps and a warmer world decrease the amount of northern-latitude sea ice; polar bears need sea ice to hunt seals for survival, so once the sea ice is gone, the polar bear will disappear, too. You might have noticed, however, that you have not heard nearly as much about the blighted cause of the noble polar bear in recent years. There is a good reason why the polar bear cause has fallen out of vogue: over the past twenty-five years, polar bear populations in the northern latitudes have done nothing but grow and expand (Figure 13).
A CONSISTENT PATTERN
As should be evident from these myriad examples, there is a consistent pattern emerging in how the human-induced climate change narrative is communicated to the public. The pattern relies on inflammatory and fear-inducing-by-design headlines that, if taken literally or on faith, imply some calamitous outcome to some portion of humanity. If you have the time or inclination to research the actual article, you usually find that the conclusion either has no connection to the underlying scientific “research” or uses information manipulation tactics—such as time series truncation, Y-axis manipulation, deceptive averaging, or reference data series that are not shown—to deliberately convert what is often honest scientific inquiry into outright propaganda.
In other words, we are looking at a classic “the emperor has no clothes” situation. However, unlike in the Hans Christian Andersen folk tale, we don’t have a brave little girl to point out the obvious reality of the situation. (Well, we kind of do—she just happens to be advocating for maintaining the illusion. And Greta is from Sweden; Andersen was Danish.) In place of brave little girls, we are forced to rely on the rare truth-telling and uncompromised “experts.”
I would be more inclined to trust and believe the human-induced climate change “experts” if they would start answering dissenting questions or at least rectify some of the blatant inconsistencies in the mainstream media narrative. Here is a good one to start: if atmospheric carbon dioxide is the main control of Earth’s climate, and if current atmospheric carbon dioxide levels are the highest they have been in millions of years through the combustion of hydrocarbons, why was Arctic ice cap melt and sea level rise fifteen times higher ten thousand years ago, when atmospheric carbon dioxide was half the current level?
In the fourth and last installment of my global climate change series, I will come to the rubber-meets-the-road moment of our discussion: the cost. What is being asked of ordinary citizens to combat the purportedly existential threat of human-induced climate change?
REFERENCES
- Mann ME, Bradley RS, Hughes MK. Global-scale temperature patterns and climate forcing over the past six centuries. Nature. 1998 23 Apr;392:779-787.
- http://theconsensusproject.com/
- Cook J, Nuccitelli D, Green SA, et al. Quantifying the consensus on anthropogenic global warming in the scientific literature. Environ Res Lett. 2013;8:024024. https://iopscience.iop.org/article/10.1088/1748-9326/8/2/024024
- “Scientific consensus on climate change.” Wikipedia. https://en.wikipedia.org/wiki/Scientific_consensus_on_climate_change
- Ritchie EJ. Fact checking the claim of 97% consensus on anthropogenic climate change. Forbes, Dec. 14, 2016.
- Curry J. The toxic rhetoric of climate change. Climate Etc., Dec. 14, 2019. https://judithcurry.com/2019/12/14/the-toxic-rhetoric-of-climate-change/
- Johnston H. Freeman Dyson: the visionary thinker and maverick scientist who challenged authority. Physics World, May 16, 2023.
- Plimer I. Heaven and Earth: Global Warming, the Missing Science. Taylor Trade Publishing, 2009.
- https://heartland.org/about-us/who-we-are/ivar-giaever/
- Meet Dr Patrick Moore: a true environmentalist, climate change realist, and co-founder of Greenpeace who left after its hijacking by the political left. BizNews, May 8, 2023.
- Steven Koonin on The Limitations of Climate Change Models. Hoover Institution, Oct. 12, 2023. https://www.youtube.com/watch?v=acyErLNL7kQ&ab
- Kirkpatrick J. The obscure origins of modern-day climate change hysteria. Wise Traditions. Fall 2023;24(3):77-86.
- Zinsner H. Posts mislead about record-setting Canadian wildfires fueled by climate change. FactCheck.org, Feb. 9, 2024.
This article appeared in Wise Traditions in Food, Farming and the Healing Arts, the quarterly journal of the Weston A. Price Foundation, Fall 2024
🖨️ Print post
These climate article by James are great and I would like to read more from him. But, I have not been able to locate anything else that seems to be a match from James Kirkpatrick at JKF Associates. Coule anyone send me a lead? Thank you.